TripActions Fall 2022 Business Travel Preview

Kelly Soderlund

- Business trips bookings for fall travel up nearly 6x year-over-year
- After a flat summer, travel spend jumped 27% in August, with another 30% increase projected in September
- Flight booking prices in both the U.S. and EU now lower than in 2019
- Team Travel bookings jumped 73% in August, as an increasingly global workforce looks to strengthen company culture
- Connecting distributed teams No 1 reason for business travel purpose
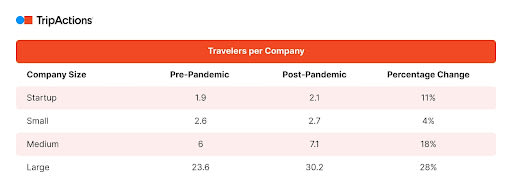
- Trips per company and travelers per company on the rise
- Engineering, marketing, and product teams continue to increase share of bookings
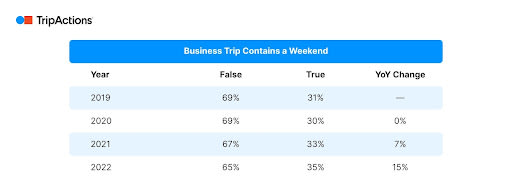
- Business and leisure trips continue to blend, with 35% of business travel bookings now including a weekend
Introduction
Autumn is conference season—a time that has grown in importance following the pandemic, as an increasingly distributed workforce looks to make the most out of travel by meeting with colleagues, industry peers, and clients to advance business goals. While the importance of the season has grown, the trend follows last September, when TripActions was one of the first to note an uptick in business travel, with the Delta variant subsiding and business travelers eager to get back on the road.
Once again, signs are pointing to a similar seasonal surge in business travel, despite concerns about the macroeconomic environment. Will this conference season shape up to be a mini-Workchella? Consider this: Delta Air Lines and others have signaled strong forward bookings for travel this fall, and TripActions data show a nearly 6x year-over-year increase in business travel bookings with a start date between September 1 and November 19, 2022, compared to an equivalent booking window and trip start date last year.
Additionally, the week following Labor Day—when business travel historically sees a seasonal uptick—broke TripActions’ largest booking and travel spend records, with a 28% increase week-over-week.
It’s just the beginning of the trends we’re tracking. TripActions did a deep dive through its reams of travel and spend data to assess the latest trends in traveler personas, travel spend, team travel, personal travel, transportation options, and more.
Let’s go.
Where Are Travelers Going?
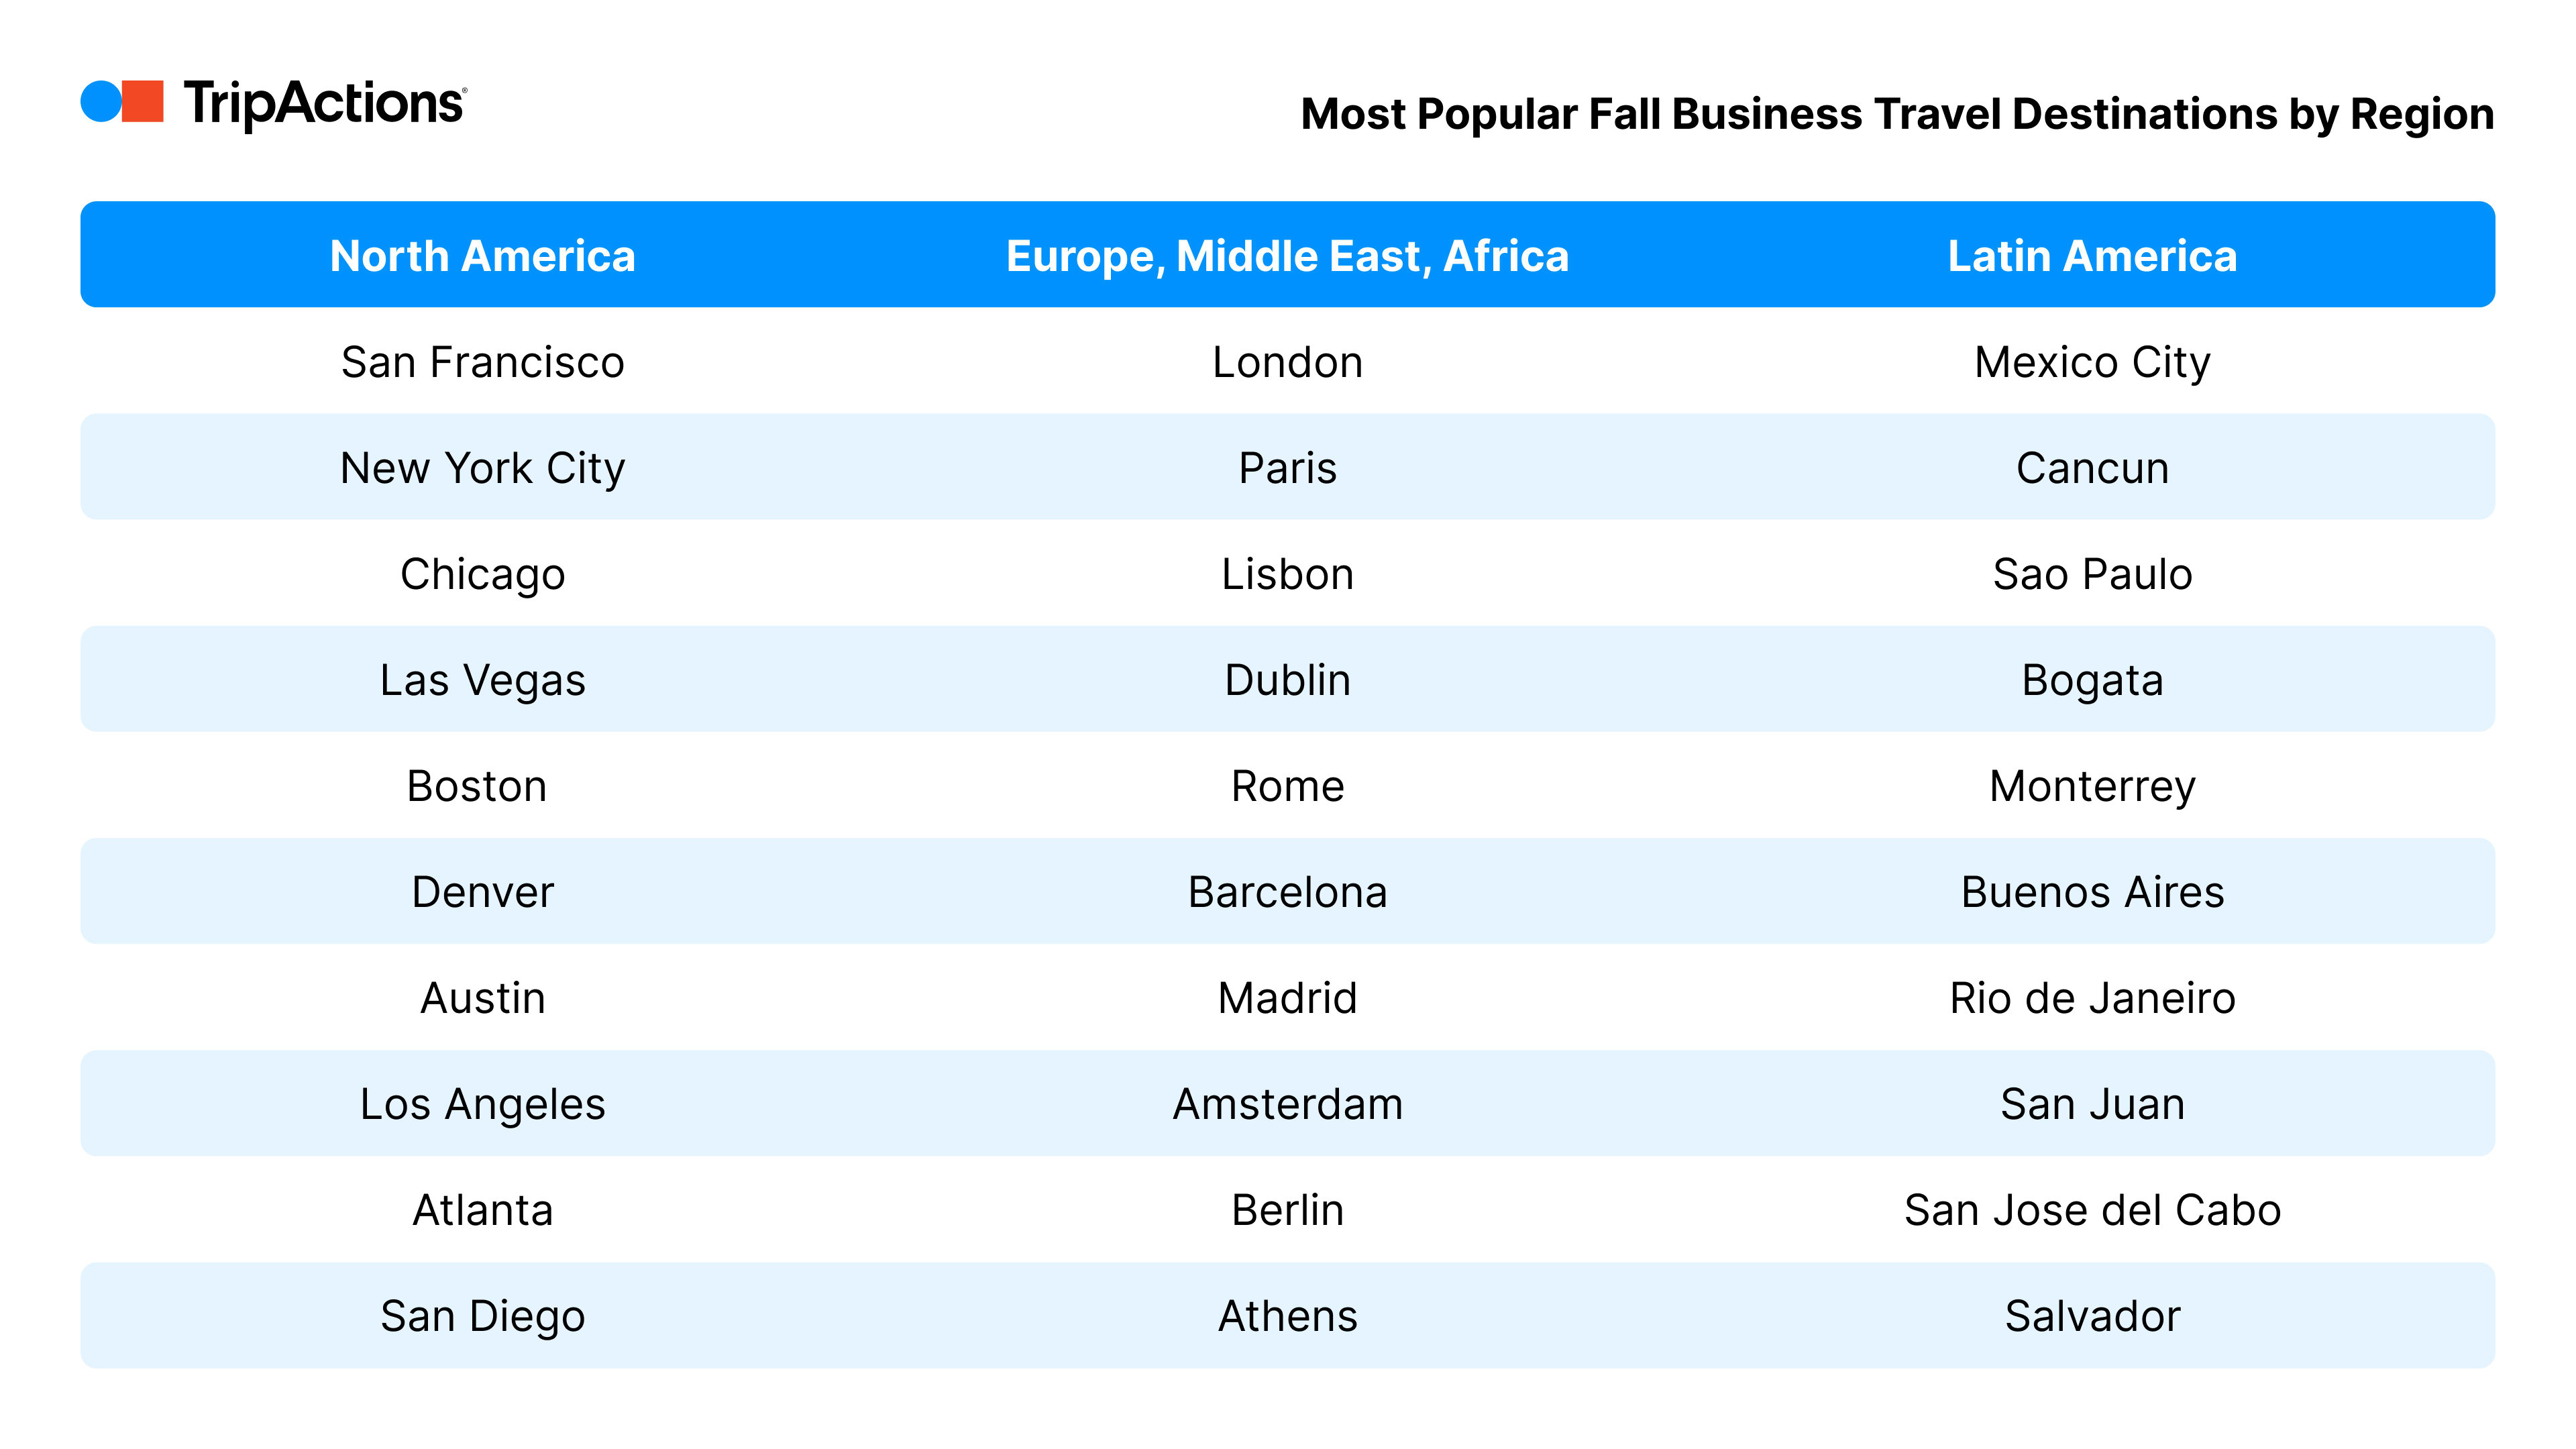
Where are business travelers headed this fall? Not surprisingly, conference meccas make a strong showing, as do other global urban metros such as San Francisco, London, Las Vegas, Mexico City, Paris, and Lisbon. Here are the leading destinations by region for business trips booked with TripActions with a start date between September 1 and November 19, 2022.
Travel Spend
While travel spend over the peak vacation months of May through July remained relatively flat, August—when kids go back to school and business travel bookings jumpstart—saw a whopping 27% in August compared to July to become TripActions’ biggest month for travel spend since the launch of TripActions Liquid. And TripActions predicts that September will be even stronger, with a 30% increase in travel spend compared with August. It’s yet another sign that the fall conference season could well experience a significant rebound this fall.
Transaction volume processed via TripActions Liquid has followed a similar pattern, with a slight 6% decrease in July followed by a 20% increase in August.
Flight Prices
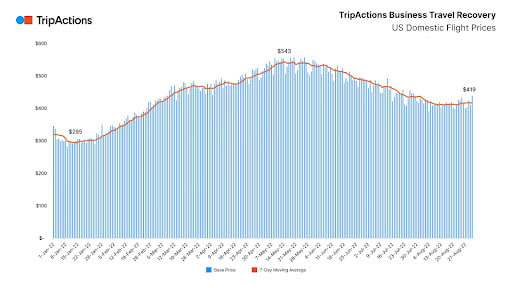
U.S. domestic average daily booking prices decreased from their summer peak, dropping 23% from $543 in mid-May to $419 to close the month of August. The average U.S. domestic flight booking price for August was $416—about $10 cheaper than in August of 2019, when the average U.S. domestic flight price was $427.
On-Trip Spend
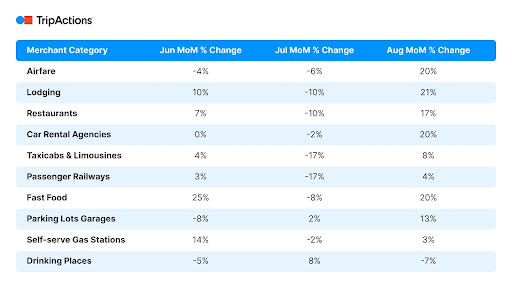
How are employees spending company money for travel and while on a trip? Based on TripActions Liquid data, total spend amount for flights dropped 10 percentage points over the summer months, but rebounded strongly in August with a 20% month-over-month increase—finishing 9% higher than in May 2022.
Lodging and car rentals similarly recorded a month-over-month increase of about 20% in August, as did fast food purchases. Based on TripActions Liquid data, the only category of spend in the top 10 to decrease in the month of August was for alcohol.
"With business travel coming back in force, customers are increasingly interested in managing their travel spend in real time,” said Michael Sindicich, General Manager of TripActions Liquid. “Seventy percent of employee expenses emanate from travel and entertainment—and with an increasingly global workforce, companies are looking to travel to help build in-person connections. The magic of Liquid is that it gives finance teams total visibility on how and where their employees are spending most.”
TripActions Liquid allows companies to give corporate cards to all employees, thanks to the ability for finance teams to set granular policies in order to maintain control over spend. When travelers swipe their cards, purchases are automatically reconciled in real time, so there’s no need to save receipts or submit expense reports.
Who’s Traveling?
Early in the pandemic, TripActions posited that a distributed workforce would lead to the rise of new categories of travel, including supercommuters and team travel.
That was not, of course, the prevailing narrative at the time, when some speculated that perhaps 50% of business travel would be lost to video conferencing. But TripActions’ hypothesis was that whatever void was created by video calls would be at least partially replaced by increases in travel from employees who traditionally didn’t travel very often, such as engineers and product teams —potentially surpassing pre-pandemic business travel levels.
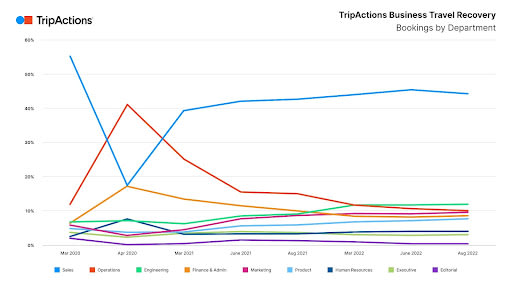
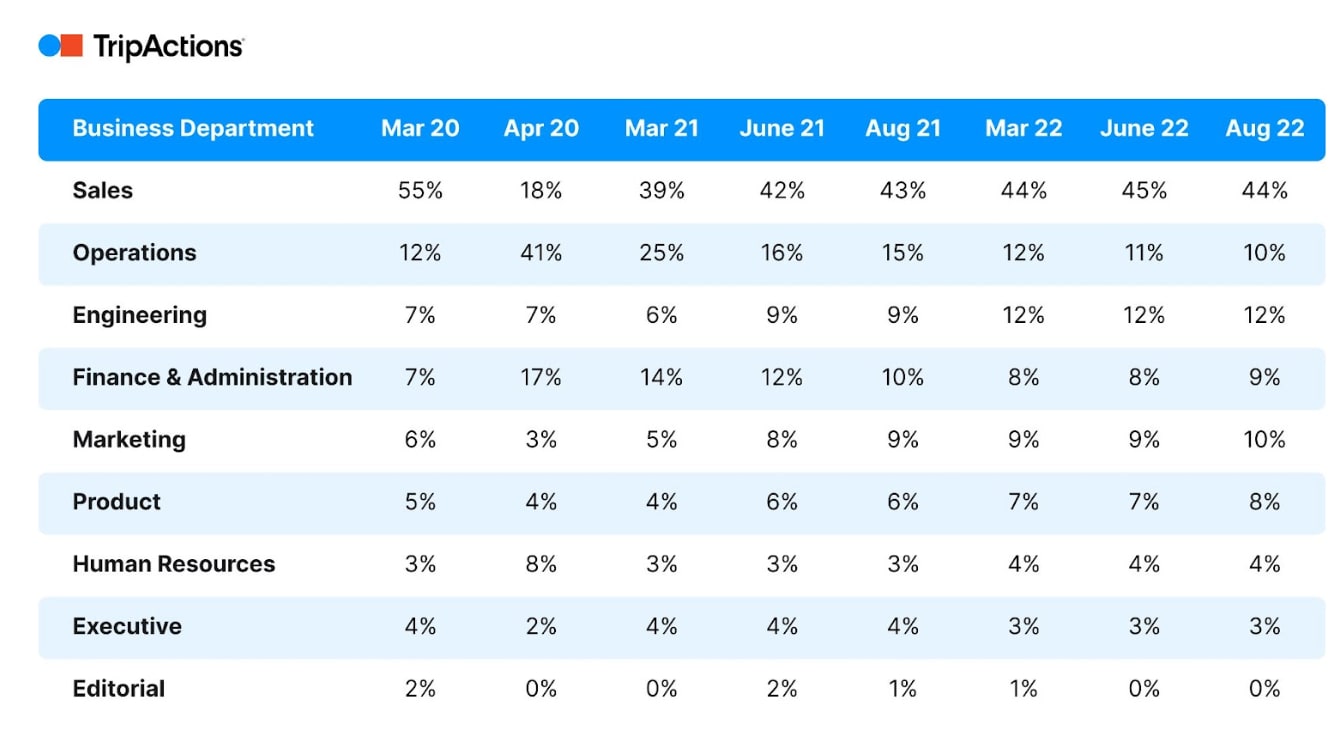
The data continue to support the TripActions prediction. Engineers increased their share of travel from 7% of business travel bookings by department pre-pandemic to 12% now. Product teams have increased their share of travel from 5% to 8%, and marketing teams have also seen a large jump from the pre-pandemic era, moving from 6% to 10%. Not surprisingly, sales teams continue to claim a plurality of the share of business travel.
Trips Are Increasing Per Company and Per Traveler
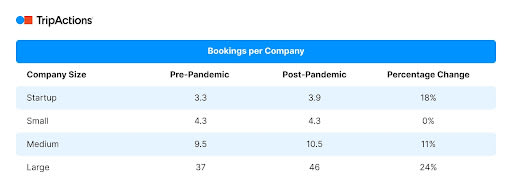
The expanding diversification of who at a company is traveling for business has been coupled with an increase in the average number of daily bookings per company. Almost across the board, the average number of daily bookings per company is on the rise, with large companies increasing the volume of daily bookings by 24% compared to pre-pandemic times—an average of an extra 3,300 bookings per year.
And it’s not just the number of bookings per company that is increasing post-pandemic as compared to pre-pandemic—so is the average number of individual travelers booking travel per company on a daily basis.
Team Travel
Much as TripActions’ travel booking and spend data show a large uptick in August, so too do Team Travel bookings, with a whopping 73% increase in August as compared to July. For those who have been watching the shifts in travel purposes, this statistic may come as no surprise: After all, with an increasingly global workforce, companies are now depending on travel to maintain a cohesive company culture.
“Today’s work models are by default global,” says Nina Herold, EVP and GM of Travel at TripActions. “How we’ve traditionally thought of road warriors is shifting—sales are still high priority, but now we’re seeing customers place as much importance on team travel and strengthening culture as we do for sales wins.”
Road Warrior, Redefined
In a recent survey of road warriors, TripActions asked respondents to rank the most common use case for business travel currently at their organization. And while sales-driven meetings remain the plurality of business travel, representing approximately 33% of business travel use cases, team on-sites and office visits aren’t too far behind at 26%. Combined, respondents indicated that team on-sites and off-sites represent 38% of business travel use cases.
Further, when asked what the biggest benefit of travel was to their respective businesses, 65% of road warriors called out relationship-building, whether with teammates or with customers. The plurality (34%) stated that business travel allowed distributed teams to stay connected and work better together.
To support this increasingly global workforce, TripActions offers customers a variety of products and services to help bring together distributed teams. One example: The Team Travel tool, which streamlines the entire group travel experience for up to 50 employees, from policy controls to booking.
Blended Travel
With vacation season in full swing, personal travel bookings through TripActions—a separate and distinct offering from the business travel solution—averaged 33% growth in monthly bookings in Q2 2022.
Recent third-party surveys of business travelers have found a priority on leisure:
- 65% plan to combine business and leisure trips in 2022
- 57% admit to choosing work trips based on the destination
- 44% have turned down work trips due to a lack of leisure time at the destination
Since the onset of the pandemic, TripActions has seen a marked shift in business trips that contain a weekend. In 2019, 31% of business trips included a weekend. Now, that share has grown to 35%—an increase of 4 percentage points.
It’s another trend that TripActions has been out in front of, by allowing travelers to extend business trips with personal time while keeping payment and accounting separate. This helps companies establish clear boundaries for personal trip expenses and gives employees the chance to tap into corporate travel benefits—making blended travel more convenient and economical.
Europe-Based Business Travel
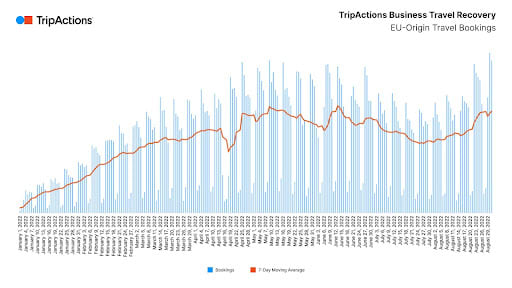
EU-origin travel bookings recorded a similar seasonal bump from July to August, increasing 24% month-over-month, after decreasing 20% from June to July.
EU Flight Prices
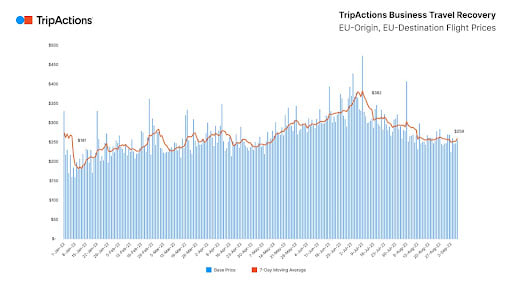
Flight prices within Europe (EU-origin, EU-destination) have followed a similar pattern to the U.S., dropping 47% from the summer peak of $382 to close August at $259. The average August flight booking price for EU-origin, EU-destination was $261—$10 less than in August 2019, when the average was $271.
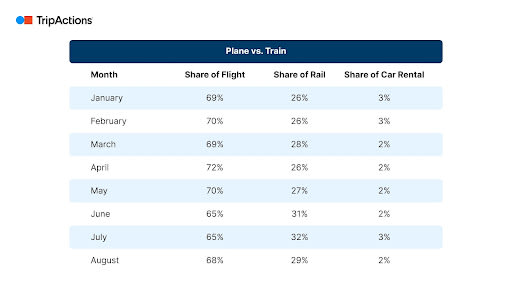
Plane Versus Train
TripActions saw a slight increase in the share of train bookings during the busy summer months, when flight disruptions peaked. Rail appears to be settling back to more traditional levels as flight prices have dropped and we move into autumn, when business travelers don’t have to compete with throngs of leisure travelers.
Conclusion
Autumn is shaping up to be a blockbuster season for business travel, thanks to a combination of conferences, team off-sites, and personal travel extensions. The purpose behind some trips may have shifted, and the typical traveler may now come from a different department. But based on TripActions’ booking and spending data, there’s no question that the enthusiasm for hitting the road has returned. Of course, these new patterns are far from settled, and new developments are likely to appear. It’s why TripActions is constantly analyzing our data and extrapolating what hints it may hold for the future, ensuring we can stay ahead of the trends and continue to develop new products to make the entire process of travel and spend even smarter and more streamlined for our customers.